Plotting a Ramachandran map with matplotlib
In [1]: import mdtraj
Lets load up the trajectory that we simulated in a previous example
In [2]: traj = mdtraj.load('ala2.h5')

In [3]: atoms, bonds = traj.topology.to_dataframe()

In [4]: print atoms
       name element  resSeq resName  chainID
serial
0        H1       H       0     ACE        0
1       CH3       C       0     ACE        0
2        H2       H       0     ACE        0
3        H3       H       0     ACE        0
4         C       C       0     ACE        0
5         O       O       0     ACE        0
6         N       N       1     ALA        0
7         H       H       1     ALA        0
8        CA       C       1     ALA        0
9        HA       H       1     ALA        0
10       CB       C       1     ALA        0
11      HB1       H       1     ALA        0
12      HB2       H       1     ALA        0
13      HB3       H       1     ALA        0
14        C       C       1     ALA        0
15        O       O       1     ALA        0
16        N       N       2     NME        0
17        H       H       2     NME        0
18        C       C       2     NME        0
19       H1       H       2     NME        0
20       H2       H       2     NME        0
21       H3       H       2     NME        0
Because alanine dipeptide is a little nonstandard in the sense that it’s basically dominated by the ACE and NME capping residues, we need to find the indicies of the atoms involved in the phi and psi angles somewhat manually. For standard cases, see geometry.compute_phi() and geometry.compute_psi() for easier solutions that don’t require you to manually find the indices of each dihedral angle.
In this case, we’re just specifying the four atoms that together parameterize the phi and psi dihedral angles.
In [5]: psi_indices, phi_indices = [6, 8, 14, 16], [4, 6, 8, 14]

In [6]: angles = mdtraj.geometry.compute_dihedrals(traj, [phi_indices, psi_indices])
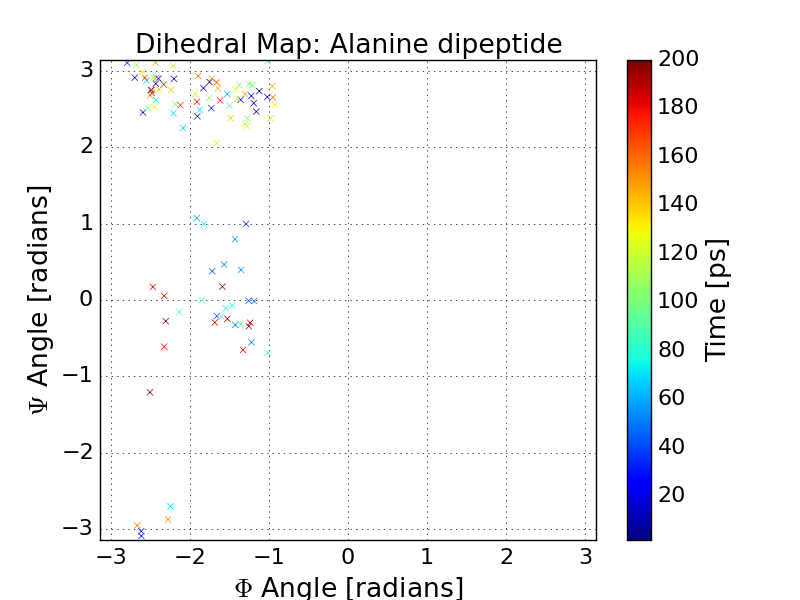
Lets plot our dihedral angles in a scatter plot using matplotlib. What conformational states of Alanine dipeptide did we sample?
In [7]: import matplotlib

In [8]: import matplotlib.pyplot as pp

In [9]: from math import pi

In [10]: pp.figure();

In [11]: pp.title('Dihedral Map: Alanine dipeptide')
Out[11]: <matplotlib.text.Text at 0x110b3b5d0>

In [12]: pp.scatter(angles[:, 0], angles[:, 1], marker='x', c=traj.time)
Out[12]: <matplotlib.collections.PathCollection at 0x110b6ef10>

In [13]: cbar = pp.colorbar()

In [14]: cbar.set_label('Time [ps]')

In [15]: pp.xlabel(r'$\Phi$ Angle [radians]')
Out[15]: <matplotlib.text.Text at 0x110a16550>

In [16]: pp.xlim(-pi, pi)
Out[16]: (-3.141592653589793, 3.141592653589793)

In [17]: pp.ylabel(r'$\Psi$ Angle [radians]')
Out[17]: <matplotlib.text.Text at 0x110ae3c90>

In [18]: pp.ylim(-pi, pi)
Out[18]: (-3.141592653589793, 3.141592653589793)