Baker-Hubbard hydrogen bond identification
In [1]: import itertools

In [2]: import mdtraj as md

In [3]: import mdtraj.testing
Load up some example data. This is a little 20 frame PDB, straight from the RCSB
In [4]: path = mdtraj.testing.get_fn('2EQQ.pdb')

In [5]: t = md.load(path)

In [6]: print t
<mdtraj.Trajectory with 20 frames, 423 atoms>
md.baker_hubbard() idenfies hydrogen bonds baced on cutoffs for the Donor-H...Acceptor distance and angle. The criterion employed is \(\theta > 120\) and \(r_\text{H...Acceptor} < 2.5 A\) in at least 10% of the trajectory. The return value is a list of the indices of the atoms (donor, h, acceptor) that satisfy this criteria.
In [7]: hbonds = md.baker_hubbard(t)
In [8]: label = lambda hbond : '%s -- %s' % (t.topology.atom(hbond[0]), t.topology.atom(hbond[2]))
In [9]: for hbond in hbonds:
...: print label(hbond)
...:
GLU1-N -- GLU1-OE2
GLU1-N -- GLU1-OE1
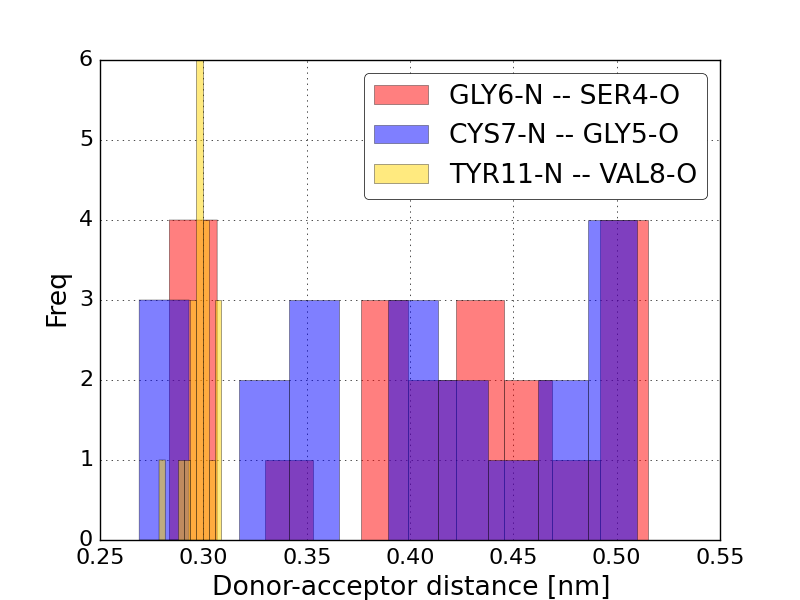
GLY6-N -- SER4-O
CYS7-N -- GLY5-O
TYR11-N -- VAL8-O
MET12-N -- LYS20-O
ARG13-NH1 -- TYR11-O
THR14-N -- ARG18-O
ASP16-N -- ASP16-OD1
GLY17-N -- THR14-O
ARG18-N -- THR14-OG1
ARG18-NE -- ASP16-OD2
LYS20-N -- MET12-O
THR22-N -- GLY10-O
THR14-OG1 -- ASP16-OD1
THR28-OG1 -- ILE27-O
Let’s compute the actual distances between the donors and acceptors
In [10]: da_distances = md.compute_distances(t, hbonds[:, [0,2]], periodic=False)
Plot a histogram for a few of them
In [11]: import matplotlib.pyplot as pp

In [12]: pp.figure();

In [13]: color = itertools.cycle(['r', 'b', 'gold'])

In [14]: for i in [2, 3, 4]:
   ....:     pp.hist(da_distances[:, i], color=next(color), label=label(hbonds[i]), alpha=0.5)
   ....:

In [15]: pp.ylabel('Freq');

In [16]: pp.legend();

In [17]: pp.xlabel('Donor-acceptor distance [nm]')
Out[17]: <matplotlib.text.Text at 0x10b1e1310>